all&all
Clojurescript Is Easy
Getting set up with cljs just couldn’t be easier.
To begin with, I always start my projects off with the following folder structure:
- /
- /lib
- cljs.jar
- /assets
- /js
- /css
- /lib
- /src
So my src folder is my source, and my assets folder is where the output goes.
Note that you need that lib dir, and you need cljs.jar to be in that dir. You can download it here.
Build Example
I place two files in the root of my project:
watch.clj
This file sets enables a watch-style auto-compilation on cljs file changes.
(require 'cljs.build.api)
(cljs.build.api/watch "src"
  {:main 'hello-world.core
   :output-to "assets/js/cljs.js"
   :output-dir "assets/js/"
   })
watch.sh
Because you need java to actually run the watch.clj file, and because i always forget the exact java command, i make a bash script to make it easy.
#! /bin/bash
java -cp lib/cljs.jar:src clojure.main build.clj
So as long as you have a .cljs file in /src, we can now run . watch.sh and as we do our dev, it gets compiled and placed in /assets/js. So easy.
A Real Example
Ok, so here we go. I want to see how quickly/easily i can get google visualization library to work with cljs. Let’s start out with a super simple html page for our test:
index.html
Ok so we got some google viz loading in here, and then finally our cljs.js file as well.
<!doctype html>
<html lang="en">
<head>
  <meta charset="utf-8">
  <title>cljs viz</title>
  <meta name="description" content="">
  <meta name="author" content="">
</head>
<body>
	<div id="chart_div" />
  	<script type="text/javascript" src="https://www.google.com/jsapi?autoload={'modules':[{'name':'visualization',
       'version':'1','packages':['timeline']}]}"></script>
	<script type="text/javascript">
	  // Load the Visualization API and the piechart package.
	  google.load('visualization', '1.0', {'packages':['corechart']});
	</script>
  	<script src="/assets/js/cljs.js"></script>
</body>
</html>
src/main.cljs
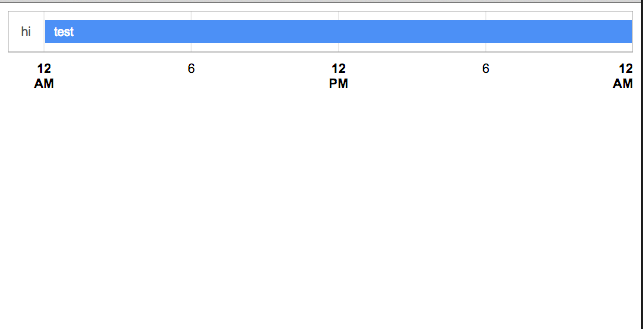
In this file we’re going to take an array/vector of data and “paint” it on a timeline.
(ns hello-world.core)

;; data to be used for the viz
(def my-data [
    ;; the format here is category, name, start date, end date
	["hi" "test" (js/Date. 2015 10 24) (js/Date. 2015 10 25)]])

(defn draw-chart []
	(let [container (.getElementById js/document "chart_div")
  		  chart (js/google.visualization.Timeline. container)
  		  data-table (js/google.visualization.DataTable. chart)]

  		(doto data-table
  			(.addColumn #js { :type "string" :id "category"})
  			(.addColumn #js { :type "string" :id "name"})
  			(.addColumn #js { :type "date" :id "start"})
  			(.addColumn #js { :type "date" :id "end"})
  			(.addRows (clj->js my-data)))

		(.draw chart data-table)))

;; load the viz when google charts finishes loading
(.setOnLoadCallback js/google draw-chart)
A few notes on this:
- Note that in order to convert clojure maps to javascript object literals we use the
#jsreader macro. This does not work on nested objects however… - For nested objects (ie,
my-data) when we want to convert from clojure to javascript objects we use theclj->jsadapter function. dotois just so useful when dealing with object oriented libs
Easy!